|
Already read the FAQ? Click Here To Go Directly To Graphical Reports Guide to Use and Interpretation of Course Evaluation Reports | History of Instrument | The Instrument Guide to the Use and Interpretation of Course Evaluation Reports Stetson’s mission to provide a transformational education means that effective teaching is prized highly. Indeed, under our current tenure and promotion and annual evaluation guidelines, teaching accounts for 60% of our evaluation. Therefore, we long ago began various practices that attempt to evaluate teaching in order to promote faculty development. Understanding that all forms of evaluation of teaching seems always incomplete, as a faculty we agreed to include student evaluation of our courses among the information provided to faculty, department chairs, and deans. The system for evaluating teaching at Stetson University has recently undergone several changes that have resulted in a robust system, which now relies upon multiple methods and sources of data. The use of multiple evaluation methods helps ensure that an evaluation process is reliable, valid, and fair. At Stetson, these methods include self-evaluation, peer observation, and student course evaluations. Because each of these methods provides a different perspective on teaching, it is vitally important that all data be considered during faculty evaluation. Since Fall 2012, the Course Evaluation Task Force--Bob Boozer (SoBA), Dwaine Cochran (Psychology), Michael Rickman (SoM), Mercedes Tichenor (Education) and Alicia Schultheis (Biology and CERTF Chair) began development of a system for creating uniform reports of student course evaluations. These reports are intended to provide one form of evidence for evaluating teaching during the tenure and promotion and annual merit review processes. The guidelines below are intended to help faculty, department chairs, and academic deans interpret these reports.
History of Instrument Why was this course evaluation instrument and reporting system developed? As outlined in Stetson’s Tenure and Promotion policy, student course evaluations are an important means of showing progress towards meeting the standards for excellence in teaching. After the tenure and promotion policy was revised in 2010, it was clear that Stetson’s existing course evaluation instrument did not contain questions relevant to all of the new teaching standards. Thus, in 2011, the Course Evaluation Revision Task Force (CERTF) was charged with revising the existing evaluation instrument and reporting process to better align with the new tenure and promotion policy. Shortly thereafter, the Merit Review Task Force recommended that the new course evaluation instrument be used in the annual merit review process. Thus, we have approached the reporting function with a dual function in mind: to provide partial evidence towards meeting the standards for teaching excellence for tenure and promotion purposes and to provide a comprehensive, yet time efficient method for annual merit reviews. How was the instrument developed? First, we searched the literature to find aspects of teaching or ‘dimensions’ that aligned with the descriptions of the teaching standards (short and long forms) found in Stetson’s tenure and promotion policy. To be selected, dimensions also had to be correlated with student achievement and overall evaluation (i.e., good measures of teaching performance in other contexts). Five dimensions were chosen: 1) Organization and Clarity, 2) Feedback, Grades and Grading, 3) Workload, 4) Teacher Effectiveness, and 5) Accessibility. Dimensions were aligned to the T&P standards as shown in Table 1. Table 1: Alignment of Standards for Teaching Excellence and Related Dimensions. Bolded standards are associated with dimensions.
Items related to chosen dimensions (Table 1) were identified from the literature and existing instruments. We chose this approach because using questions that have already been analyzed for validity and reliability in some context increases the likelihood of having a valid and reliable instrument. Has the instrument been psychometrically evaluated? Yes. A pilot study was conducted during two terms: Spring and Summer 2012. Analysis of these data indicated construct validity of the five dimensions. We analyzed the relative weight of each of the dimensions. After the pilot, we removed several questions so that there are a total of 15 standard items on the instrument (3 per dimension). Optional questions are part of the instrument but are not included in this reporting system (because they do not appear on all evaluations). How did the process for evaluating courses change? In 2012, the University contracted with an outside vendor, IOTA Solutions to administer online evaluations and generate reports for faculty and administrative uses. The Instrument Which items are included on the standard instrument? The standard 15 items and the dimension to which they belong are shown below (dimension names in bold): Organization and Clarity
Intellectual Challenge/ Workload
Teaching Effectiveness
Feedback, Grades & Grading
Accessibility
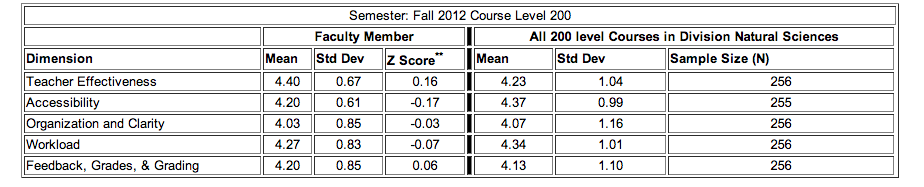
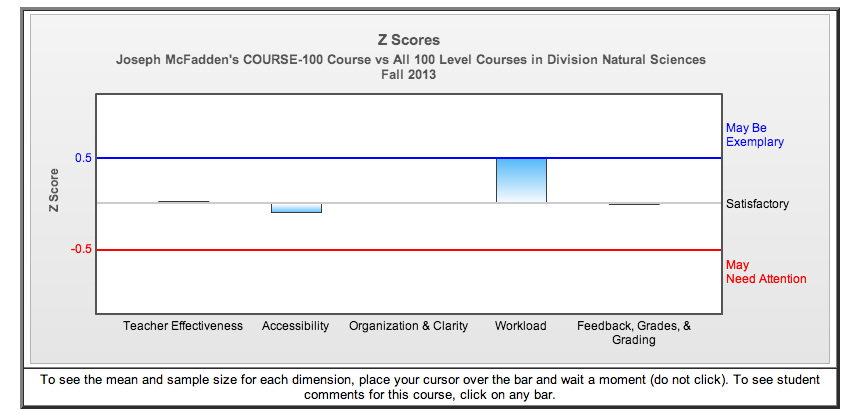
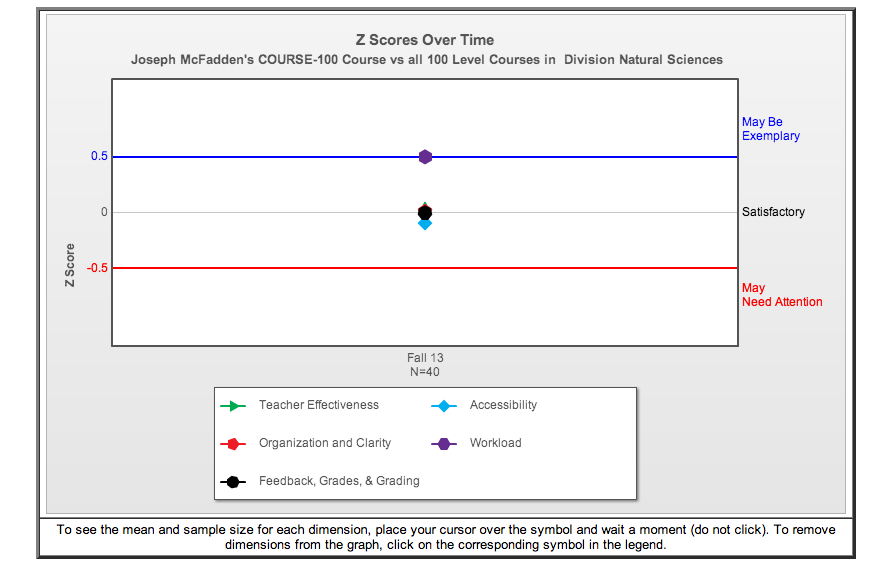
New Report Functions What does the new reporting function include? Reports will still include the standard data, i.e., item-level responses (frequencies, means and standard deviations) as well as student comments. Reports now also include graphs and tables that allow faculty and administrators to easily evaluate results in a proper comparative framework, without reducing the complexity of the instrument to a single global score-a purpose for which this instrument was explicitly NOT designed. What is the new ‘comparative framework’? It is a system which relies on a statistical measure called a ‘z-score’. Z-scores are used to compare individual courses with the average rating of all courses in their comparison group. At Stetson, the comparison groups were determined by the Provost and Deans or Associate Deans. In the case of Business, Education, Humanities, Natural Sciences, and Social Sciences, pre-existing comparative frameworks were in place and duplicated here. For example, in Business, courses are compared within Departments and across the School. In the Humanities, courses are compared to other Humanities courses of the same level (e.g., all 100-level courses, etc.). Courses in Music are compared by Course Type (e.g., large ensemble compared to other large ensemble courses, etc.) Reports also show how course ratings change over time (a period of six years will be shown when data allows). How do I know which comparative group is being used for my course? It is automatically selected when you choose a course. When you look at the table headings, you will see the name of the comparison group that is being used. The only exception is for FSEM, JSEM, and HON courses, which should be compared both to similar course types (i.e., other FSEMs) as well as within the disciplinary grouping (i.e., all 100 level Philosophy courses). In the latter case, you will have to select ‘Humanities’ as the disciplinary grouping. Can I change my comparative group? This type of change would require the approval of your Dean in consultation with the Provost. Are all courses included in the assessment? Courses with low enrollment (sample sizes smaller than 3) are not included in the reports but will continue to be evaluated as future reporting possibilities are anticipated. Also, no reports are generated for summer courses because they fall outside the annual contract period and are thus not evaluated for tenure and promotion purposes. Z-Scores What does a Z-score indicate about my performance? A Z-score of zero indicates that your course mean is equal to the mean of your particular comparison group. A Z-score = 1.0 indicates that your course mean is one standard deviation above the mean of all such courses. If Z is a negative number, your course mean is below the mean of all courses. I have no idea what all this statistical jargon means…can you explain a Z-score? First, let’s review some of the other statistical terms used in this document:
Ok, now that we’ve cleared those up, let’s tackle the Z-score: The Z-score is a measure of performance relative to others teaching similar courses. It measures how much your course mean differs from the mean of ratings of all similar courses in that disciplinary grouping. It uses standard deviation to show how your difference compares with the typical difference found with similar courses. Thus, the Z-score indicates the number of standard deviations that your course mean differs from the mean of ratings from all similar courses. How should Z-scores be interpreted?
Course mean ratings are considered satisfactory and partial evidence for
meeting the standards for tenure and promotion if they have a Z score
between +0.5 and -0 .5. This range indicates 0.5 standard deviations
above and below the mean. We used this delineation to analyze one
semester of data and found that approximately 80% of Stetson courses
fell within this range and that ~ 10% of Z-scores were > +0 .5; thus,
these may be considered exemplary. Thus, using this system, we expect
that ~ 90% of course ratings will be considered satisfactory or
exemplary. Z-scores lower than -0.5 may indicate a need for
improvement; only ~10% of courses are expected to fall within this
range. Report Displays What will I see in these reports? Reports contain three major types of displays:
For the School of Business, one additional report is available that shows the mean, standard deviation and Z-score information from all courses of an instructor compared with all courses in the Business School that semester.
| ||||||||||||||||||||||||||||||